
Gold and EM: The Dollar’s Frenemies
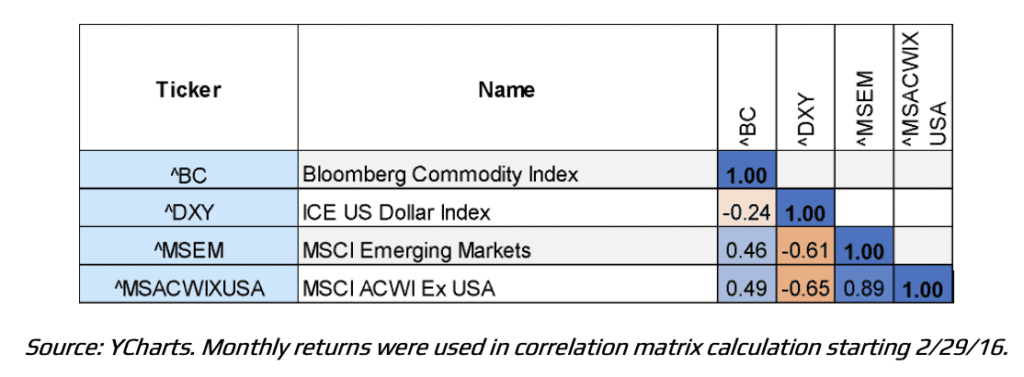
Commodities and emerging markets have continued to be key drivers of globally diversified portfolios over the past month, and the relationship is not coincidental. Historically, a broad basket of commodities, as measured by the Bloomberg Commodity Index, has shown a positive correlation with emerging market equities, represented by the MSCI Emerging Markets Index.
One major reason is the sustained weakness of the U.S. dollar over the past year. A combination of accommodative monetary policy, lingering effects of trade tensions, and ongoing geopolitical uncertainty in the United States has weighed on growth expectations. In response, central banks around the world have increased gold purchases as a hedge against further dollar devaluation. These dynamics have pushed capital flows overseas, benefiting both developed and emerging markets as investors seek diversification of traditional asset classes.
10 Year Correlation of Monthly Returns
If you have held GLDM over the past six months to a year, the recent pullback in gold toward the end of January may feel like a meaningful hit to client portfolios. However, even amid the decline and broader short-term volatility across metals, gold is up roughly 65% over the trailing one-year period as of January 31, 2026, despite the recent 16% drawdown (shown in the chart below).
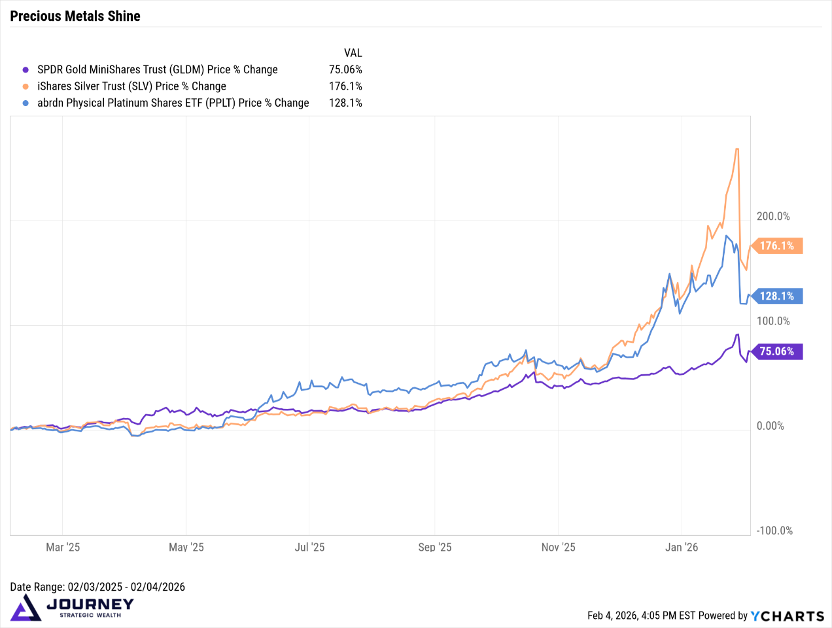
We believe the fundamental drivers of gold remain firmly in place, with upward pressure likely to persist into 2027. Recent price action appears more consistent with a period of consolidation following a strong rally than a true reversal. Much of the volatility has been driven by shifting expectations around growth, interest rates, and risk appetite, particularly following President Trump’s nomination of Kevin Warsh as the next Federal Reserve Chair, who is widely viewed as more hawkish on inflation.
When policymakers signal a greater willingness to raise rates to combat inflation rather than prioritize growth and employment, store-of-value assets such as gold and, to a lesser extent, silver tend to face near-term pressure. As an aside, silver’s recent strength appears to have been largely speculative, rather than the result of a meaningful change in underlying demand.
As a hawkish nominee can be a catalyst for interest rates rising in the US, bond yields typically react in kind and higher across the curve, attracting global capital into the United States as higher yields offer higher return. A stronger dollar often follows, reducing demand for gold and other non-yielding assets. That dynamic largely explains the recent pullback.
Periods of volatility like this are not unusual for gold, particularly when markets are processing mixed signals from economic data, central banks, and geopolitics. For long-term investors, the broader thesis remains intact.
At the same time, an unusually cold winter in Europe and the United States has driven up heating oil prices, further supporting commodity returns. Emerging market economies, many of which rely heavily on commodity exports to fuel growth, have naturally benefited from this environment. Rising commodity prices, favorable currency translation effects, and relatively higher interest rates abroad have attracted capital outflows from the United States, reinforcing emerging markets’ performance.
From SaaS to Cash: When Tech Reassesses Risk
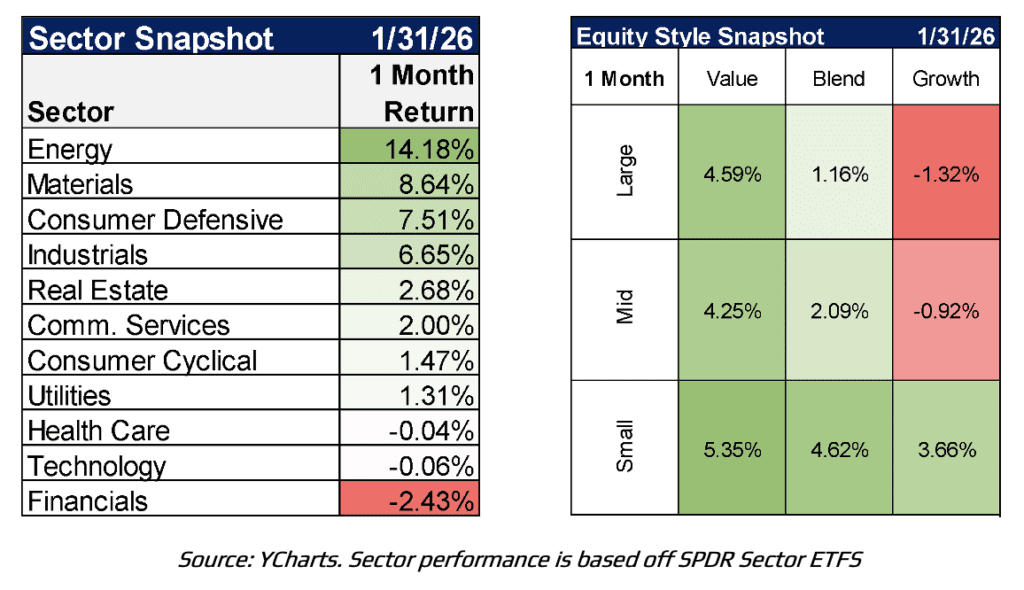
One recent development is worth noting. The market has become increasingly sensitive to the interconnected nature of the AI ecosystem, which now plays an outsized role in day-to-day performance. When Anthropic unveiled its suite of tools, widely viewed as potential substitutes for some core software functions, the announcement alone pushed the Tech Software sector into negative territory (see chart below).

Valuations across the technology sector, and especially within its subindustries, are increasingly difficult to justify. When expectations are stretched, even the first hint of flawed assumptions around future earnings can trigger sharp selloffs and share prices can unravel quickly. That said, this does not mean there is no merit in selective areas of the tech space.
When something materially changes for a company or an industry, I tend to look first at credit markets. As equity risk rises, it is often reflected in the premium investors demand to hold a company’s debt. In this case, spreads widened meaningfully for SaaS firms, signaling rising risk beneath the surface. As for the spill over into semiconductors, there is likely little fundamental linkage. However, once losses begin in SaaS, position trimming often extends to other areas with similarly elevated or perceived-to-be frothy valuations.
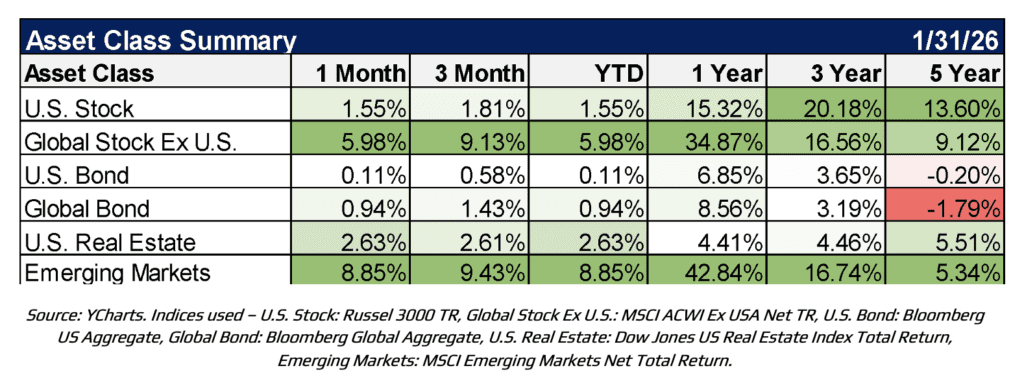
Which brings us to the rotation. Ultimately, what matters most when evaluating forward prospects is earnings. While investing outside the U.S. has lagged domestic markets over the past decade, recent policy uncertainty and shifting sentiment around AI appear to be driving a rotation toward international markets and, more notably, toward U.S. value-oriented stocks. This has been most visible in interest-rate-sensitive areas such as small caps, while growth exposures moved into negative territory in January across large- and mid-cap segments.
Earnings Under Way
Turning to earnings, as of January 31, 2026, approximately 33% of S&P 500 companies had reported fourth-quarter results above estimates. While this is below the five-year average of 78%, it remains in line with the ten-year average of 76% and is notable given the exceptionally strong growth of the past several years. The blended earnings growth rate stood near 11%, signaling a deceleration in 2025 growth compared with the prior three quarters. This is not surprising. Companies beating estimates are being rewarded less than in prior cycles, while earnings misses are no longer being punished as severely, suggesting a more normalized market response to earnings surprises.
This shift is visible in the S&P 500 performance heat map over the past three months (see below), where leadership has broadened beyond the largest technology names into other areas of the market. Larger companies have rotated away from mega-cap tech and into a wider set of sectors. To me, this signals a more discerning market, one that is placing greater emphasis on earnings quality, defensive positioning, and, potentially, income-producing equities as a way to manage tail risk in heavily concentrated portfolios.

Source: finviz.
This rotation is consistent with expectations for stronger year-over-year earnings growth in sectors such as consumer staples, utilities, and materials. That does not mean technology, industrials, or communication services will fail to contribute meaningfully to earnings growth. However, concentration in a small group of names gradually giving way to broader participation. While Mag 7 earnings are still expected to outpace the rest of the S&P 500, that advantage is projected to narrow through 2026. In our view, this sets the stage for continued rotation out of overextended technology names and into sectors where earnings growth is expected to reaccelerate, with pullbacks used as opportunities to rebalance and redeploy capital.
From the Investments Desk at Journey Strategic Wealth
This material is distributed for informational purposes only. Investment Advisory services offered through Journey Strategic Wealth, an investment adviser registered with the U.S. Securities and Exchange Commission (“SEC”). The views expressed are for informational purposes only and do not take into account any individual’s personal, financial, or tax considerations. Opinions expressed are subject to change without notice and are not intended as investment advice. Past performance is no guarantee of future results. Please see Journey Strategic Wealth’s Form ADV Part 2A and Form CRS for additional information.