

Well, What Had Happened Was…
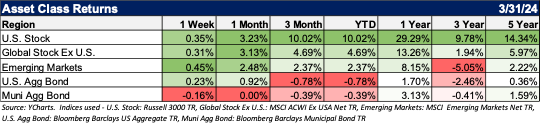
The S&P 500 index edged up 0.4% this week to a fresh record close as the market benchmark wrapped up its strongest Q1 in five years. The S&P 500 ended the shortened Holiday week up +10% from the end of 2023. This is the largest percentage increase the index has achieved in the first quarter of any year since a 13% rally in 2019.
There was more good news on Friday when the financial markets were closed. U.S. consumer sentiment rose unexpectedly in March to the highest in nearly three years, partly thanks to growing confidence that inflation will keep softening. Additionally, the personal consumption expenditures, or PCE, price index rose 0.3% in February, below the 0.4% forecasts. The core inflation, which strips out volatile food and energy prices, rose 0.3% in February and 2.8% year-over-year. If there is a recipe for a healthy stock market in 2024, it will likely incorporate ingredients like a softening Fed, normalized inflation, and healthy consumers.
Not In The Prediction Business.
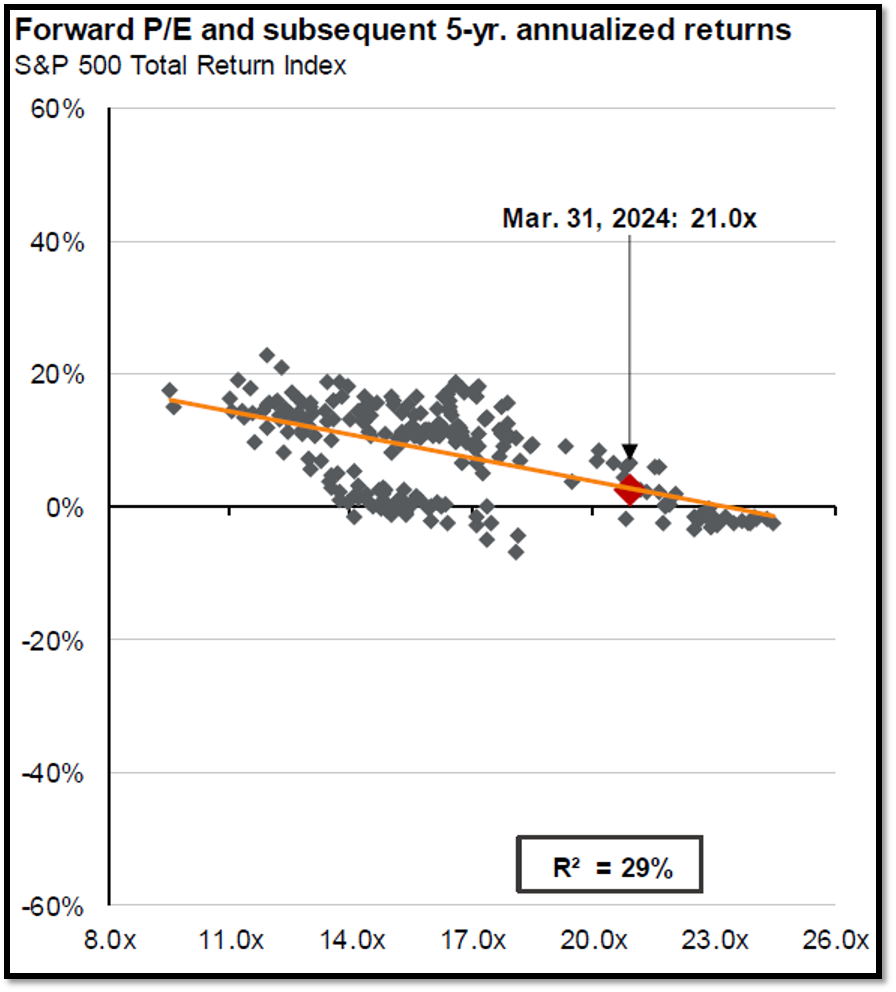
We’ve often said that we are not in the prediction business. We don’t put a year-end target for the S&P 500 or any other widely followed index. That said, one thing that is interesting about capital markets is that we have a better idea of where things might stand 5-10 years from now than whether the market will be up or down tomorrow. It’s the exact opposite of the relationship you’d have with your doctor, where they could say with certainty that you are unlikely to suffer a medical emergency tomorrow, but who knows if you’ll have a chronic medical condition five years from now. Capital market assumptions (CMAs) are largely valuation-driven. Valuations are a terrible market timing mechanism, but they are useful in understanding how markets will perform over time.
Source: FactSet, Refinitiv Datastream, Standard & Poor’s, Thompson Reuters, J.P. Morgan Asset Management.
Returns are 60-month annualized total returns, measured monthly, beginning 1/31/1999. R2 represents the percentage of total variation in total returns that can be explained by forward price-to-earnings ratios. Price-to-earnings is the market price divided by consensus analyst estimates of earnings per share for the next 12 months as provided by IBES since February 1998 and by FactSet since January 2022. U.S. date as of March 31, 2024.
This is materially different from what investors have become accustomed to for the last decade where the S&P 500 averaged 12%. A sampling of median capital market assumptions from notable asset managers like J.P. Morgan, BlackRock, Vanguard, State Street, Invesco, and Research Affiliates has a median forward return of 5.4% for U.S. Large Cap Equities.
Strategic vs. Tactical
It can be scary that stocks have a lower expected rate of return than most investors have experienced. We are not taking stocks off the table, nor would we, but our current tactical overweight to equities (specifically U.S. large caps) might change over time to reflect investors’ strategic long-term objectives. Global stocks, core bonds, and private investments can help carry what the stock market has provided in the past.

Source: A sample of publicly available 2024 CMAs. The data assumes geometric returns and a 5-10 year time horizon.
From the Investments Desk at Journey Strategic Wealth