Happy Halloween?
There were few treats and lots of nasty tricks as the S&P 500 retreated to correction territory in October, posting losses in ten of its last fourteen sessions. Ten of the eleven S&P sectors ended in the red, with only Utilities gaining for October (with all eleven sectors negative for the last 3 months). The biggest losers were the Energy sector (-5.7%), and the Communications sector (-5.5%), with steep declines following earnings reports from individual companies taking their peer groups lower. The Russell 2000 suffered losses of approximately -6.8%, and declining issues outnumbered advancing issues significantly. The declines in the stock market came despite overall strong earnings results. If that earnings trend continues, it will break a streak of three consecutive quarters of declining results. Prospects for accelerating earnings growth in the fourth quarter and into 2024, combined with easier monetary policy, remain the bull case for equities.
In the interim, the bond market benefitted from the flight to safety, as the yield on the 10-year Treasury dropped 8-basis points to 4.88%. The 2-year Treasury also slipped, leaving the 10-2 curve inversion at 19-basis points, its smallest inversion level since July 2022. This much-cited recession indicator might prove to be a false signal, as the economic data remained steady, with third-quarter GDP registering at +4.9%. The caveat to the continued strength in the economy is that much of the personal spending is coming from savings rather than income, which is not sustainable.
I know we have mentioned this before and it MAY be confirmation bias, but an inverted yield curve has historically been the time to extend the maturity and duration of bond portfolios rather than remain in cash. That may seem paradoxical to investors. Why lend money to the US government for 10 years at 5.0% (for example) when you can get 5.4% from a money market or certificate of deposit?
The answer, historically, has been reinvestment risk. Reinvestment risk is the risk that investor won’t be able to reinvest cash flows at a rate equal to their current return. It may not feel like it this month, but could occur, for example, if an economic slowdown results in the US Federal Reserve lowering interest rates.
Consider two of the past times that the yield curve was inverted, May 2000 and June 2006. In both examples, investing in intermediate to long US Treasury bonds and “locking in” the yield was a better approach than taking advantage of the elevated short-term yield and reinvesting at lower rates when short-term yields inevitably declined. In short, if you’re happy with a 5.02% yield from our current Money Market Funds, then you would likely be happier by “locking in” close to a 5% yield for 10 years.
Feeling Spooked?
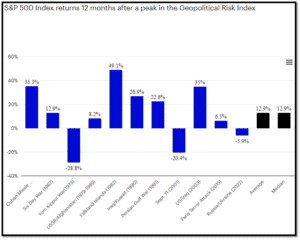
We are not making light of the geopolitical conflicts. However, historical context is important. Markets, over more than 120 years, have experienced a long-term advance despite war, recession, oil shocks, political assassinations, and much more.

Sources: Bloomberg and Economic Policy Uncertainty, Oct 15, 2023. The Geopolitical Risk Index is based on the number of articles related to adverse geopolitical events in the 10 widely distributed different newspapers (Chicago Tribune, the Daily Telegraph, Financial Times, The Globe and Mail, The Guardian, the Los Angeles Times, The New York Times, USA Today, The Wall Street Journal, and The Washington Post). An investment cannot be made directly in and index. Past performance is no indication of future results.
A Closer Look at the Yom Kippur War
The biggest outlier in the above chart is the Yom Kippur War in 1973, which was followed by a severe recession and a sharp decline in markets. This may be concerning to investors given the parallels to today’s conflict, but there are significant differences:
- The 1970s recession was fueled by the Arab oil embargo against the United States. But today, the US is significantly more energy-independent than it was back then.
- In the 1970s, inflation was beginning to rise. But in the current instance, inflation peaked well over a year ago — the US Consumer Price Index hit 9.1% in June 2022, falling to 3.7% in September 2023.
- The Federal Reserve appears to not be suffering from a credibility gap as it was in the 1970s. Inflation expectations are very well anchored in the US.
From the Investments Desk at Journey Strategic Wealth
This material is distributed for informational purposes only. Investment Advisory services offered through Journey Strategic Wealth, an investment adviser registered with the U.S. Securities and Exchange Commission (“SEC”). The views expressed are for informational purposes only and do not take into account any individual’s personal, financial, or tax considerations. Opinions expressed are subject to change without notice and are not intended as investment advice. Past performance is no guarantee of future results. Please see Journey Strategic Wealth’s Form ADV Part 2A and Form CRS for additional information.


